Philly Metro Area an Accurate Representation of America’s Current Demographic Makeup

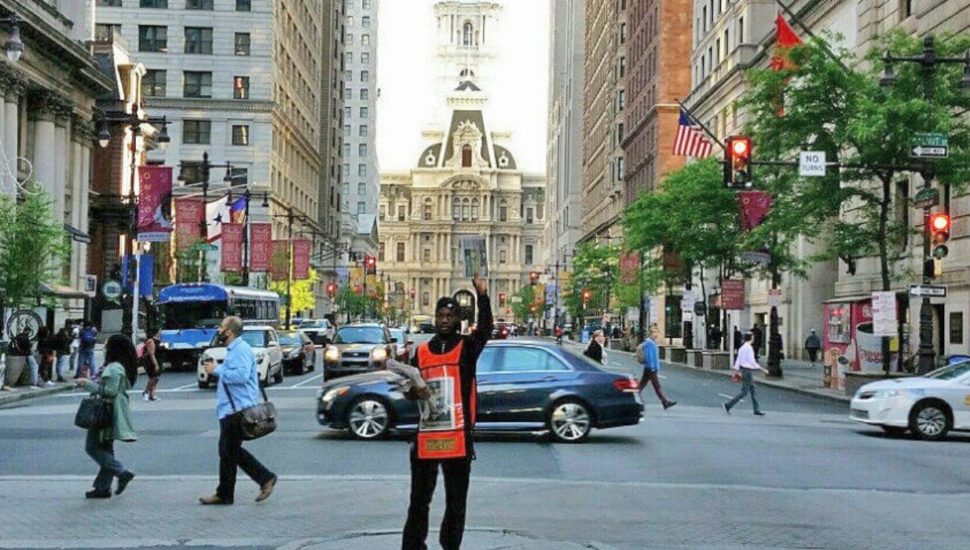
Philadelphia and its surrounding area accurately represent the country’s current demographic makeup, according to a new study by data website FiveThirtyEight, writes Adam Hermann for PhillyVoice.
To discover which metropolitan areas with at least 500,000 residents best reflect the nation’s demographic makeup, the site used various measures, including age, educational attainment, race, and ethnicity. The maximum score of 100 was for the metro area that perfectly aligned with the national demographic.
The Philadelphia metropolitan area ranked ninth nationwide with a score of 87.2. This means the Philadelphia-Camden-Wilmington area overlaps 87.2 percent with the demographic makeup of the U.S.
The New Haven-Milford metro area in Connecticut achieved the highest score of 93.2 percent, followed by the Tampa-St. Petersburg-Clearwater metro area in Florida in second place with 91.6 percent.
FiveThirtyEight also looked at which of today’s metropolitan areas best align with the demographic makeup of 1950s America. For this, the Lancaster metropolitan area came second with a 55.2 percent overlap, just behind the Ogden-Clearfield metro area in Utah.
The results point to some truth behind the old “Pennsyltucky” adage that the middle of the state and the edges are so different that they represent completely different eras in our nation’s history.
Read more about the study’s findings at PhillyVoice here.
[uam_ad id=”62465″]
Join Our Community
Never miss a Delaware County story!
"*" indicates required fields


![95000-1023_ACJ_BannerAd[1]](https://delco.today/wp-content/uploads/sites/3/2023/03/95000-1023_ACJ_BannerAd1.jpg)


