
While immigration influenced the presidential election throughout the majority of rural Pennsylvania, Chester and Delaware counties remained steadfast, writes Thomas Edsall for The New York Times.
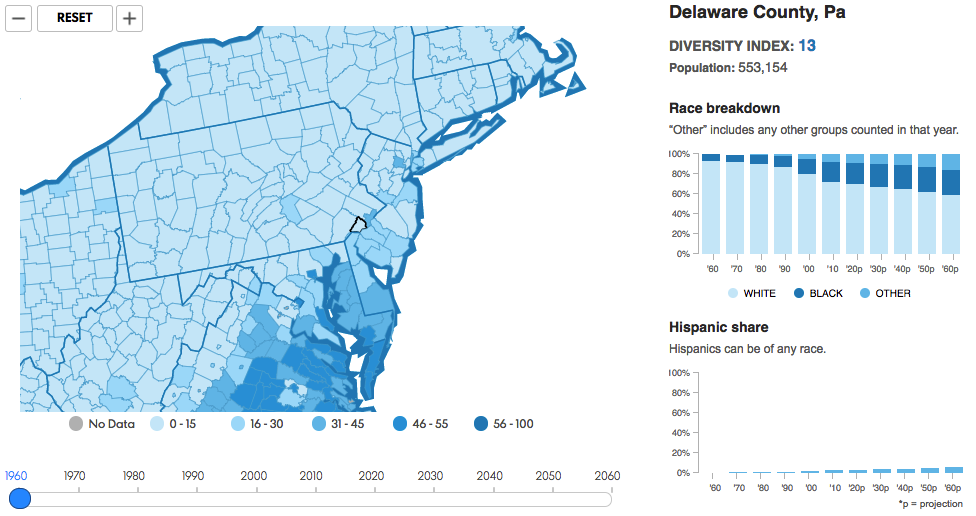
The influence of immigration, measured through the diversity index, ranks geographical areas on a scale from 0 to 100. The higher the number, the greater the chance that two randomly selected people will be from a different race and origin.
Among the states, Pennsylvania is 41 on the index, and the counties with the most significant immigration increase over the last 10 years nearly uniformly voted for Donald Trump. This was a surprise turnaround as many were firmly in Barack Obama’s corner in the last election.
Chester County has a diversity index of 32, even though its non-white population grew to 14 from 11 percent between 2000 and 2010. This has provided a much-needed labor boost, particularly in agriculture.
Delaware County has a diversity index of 46, which is above the state average. The number of non-white residents in the county rose from 20 to 28 percent between 2000 and 2010.
Nevertheless, both counties bucked the region-wide trend and voted for Hillary Clinton by a significant margin, indicating a more welcoming attitude toward immigrants.
Read more about immigration trends in The New York Times by clicking here.
[uam_ad id=”54000″]