New York Times: Here’s How Delco Stacks Up in Greenhouse Emissions
Wealthier, larger suburban homes in Delaware County farther from the city emit more planet-warming greenhouse emissions than the national average, according to data from The New York Times.
Those bigger homes have more appliances, cars, furnishing, and electronic gadgets. Its residents travel more by car and plane, which ups emissions, writes Nadja Popovich, Mira Rojanasakul, and Brad Plumer for The New York Times.
Neighborhoods near Philadelphia drive less to stores and jobs, walking, biking, or riding public transit.
They’re also more likely to live in smaller homes or apartments that require less energy.
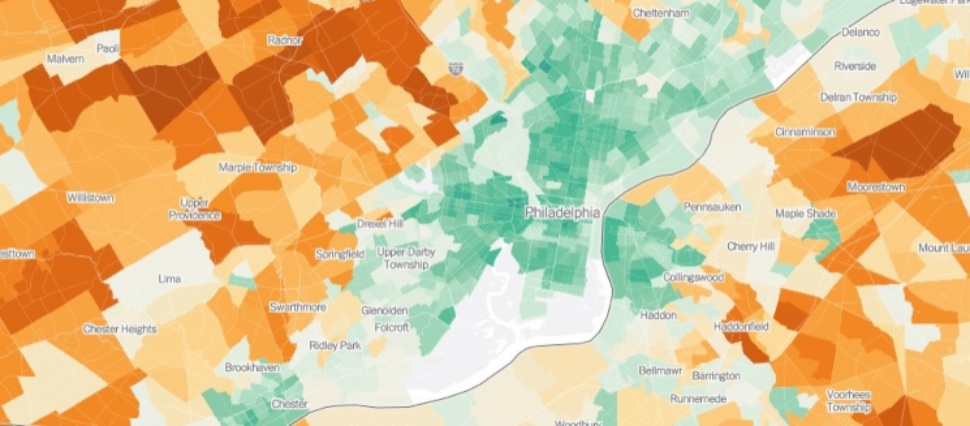
Regions in or near Upper Darby, Glenolden, Folcroft, Ridley Park, Brookhaven, Lima, Chester Heights, and Boothwyn had emissions about the same as the national average.
Chester’s greenhouse emissions were below the national average.
Regions in or near Springfield, Swarthmore, and Chadds Ford had levels either the same or higher than the national average.
Upper Providence and Radnor showed emissions much higher than the national average.
“Consumption is not the individual act we all think it is,” said Siobhan Foley, head of sustainable consumption at C40. “We treat it like a personal choice, but it’s shaped by all these other factors.”
Read more about the variation in greenhouse gas emissions depending on where you live in The New York Times.
Join Our Community
Never miss a Delaware County story!
"*" indicates required fields